Reliability UI 👀
Now let's investigate generated data in re_data UI. We first generate HTML/JSON from the data warehouse and then serve files.
re_data overview generate --start-date 2021-01-01 --interval days:1re_data overview serveinfo
We don't pass --end-date to re_data overview generate and this is causing re_data to use the default (today). We generate for this whole period to get also tests history (just ran) displayed
After running these commands you should be able to see views similar to those:
Alerts#
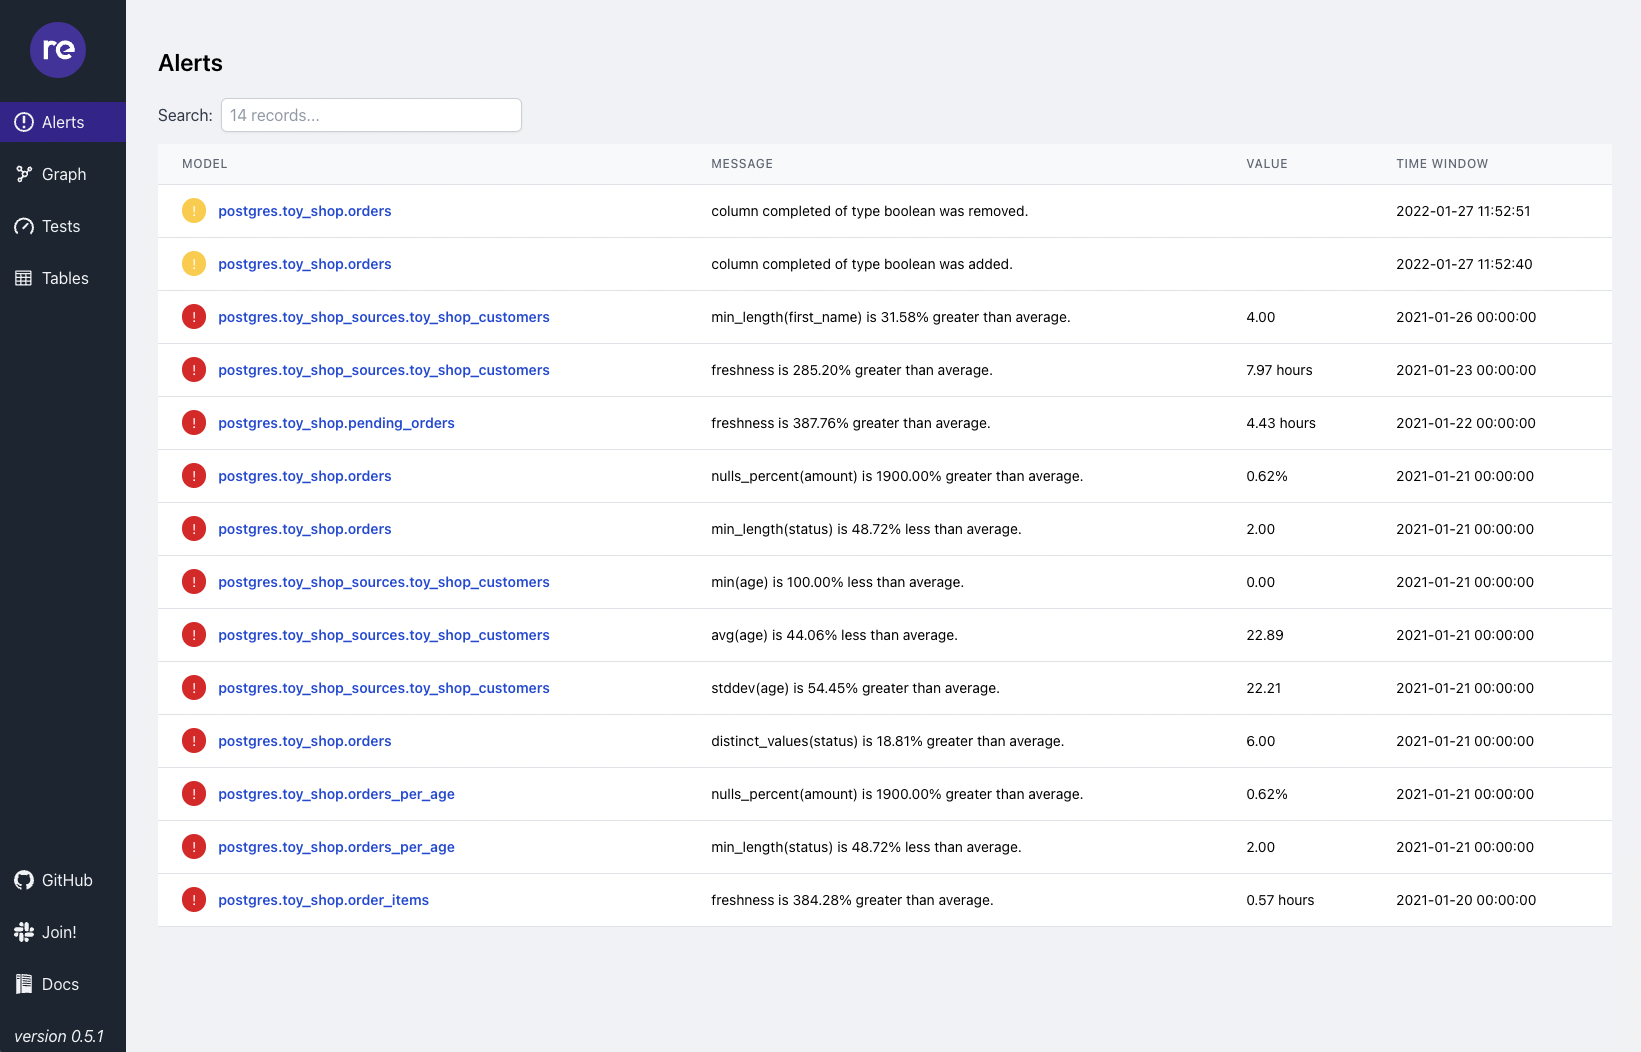
Alerts view lets you see if there are any problems currently detected in your data. re_data compares past & current metric computed using z_score to determinate if value is suspicious. It also shows any schema changes detected here.
From the alerts view, you can go to learn more details about specific alerts in the graph view.
Graph#
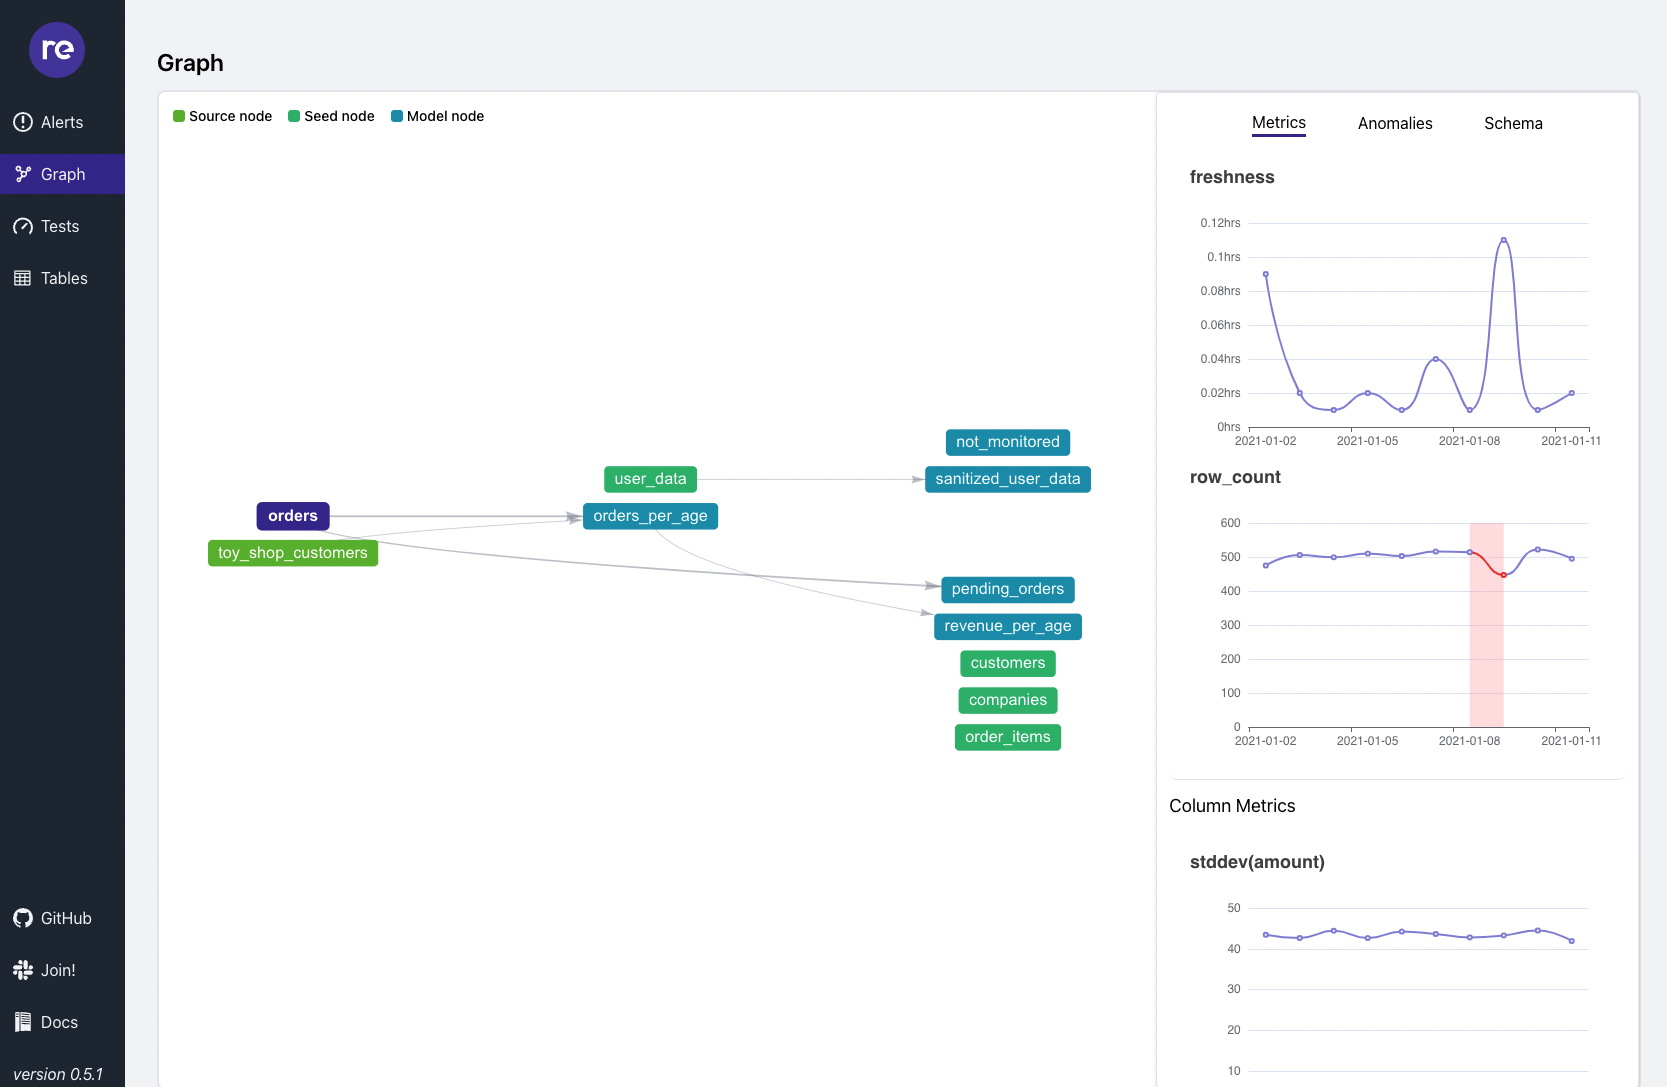
Graph view lets you investigate anomalies, metrics & schema changes on top of the dbt lineage graph.
Tests#
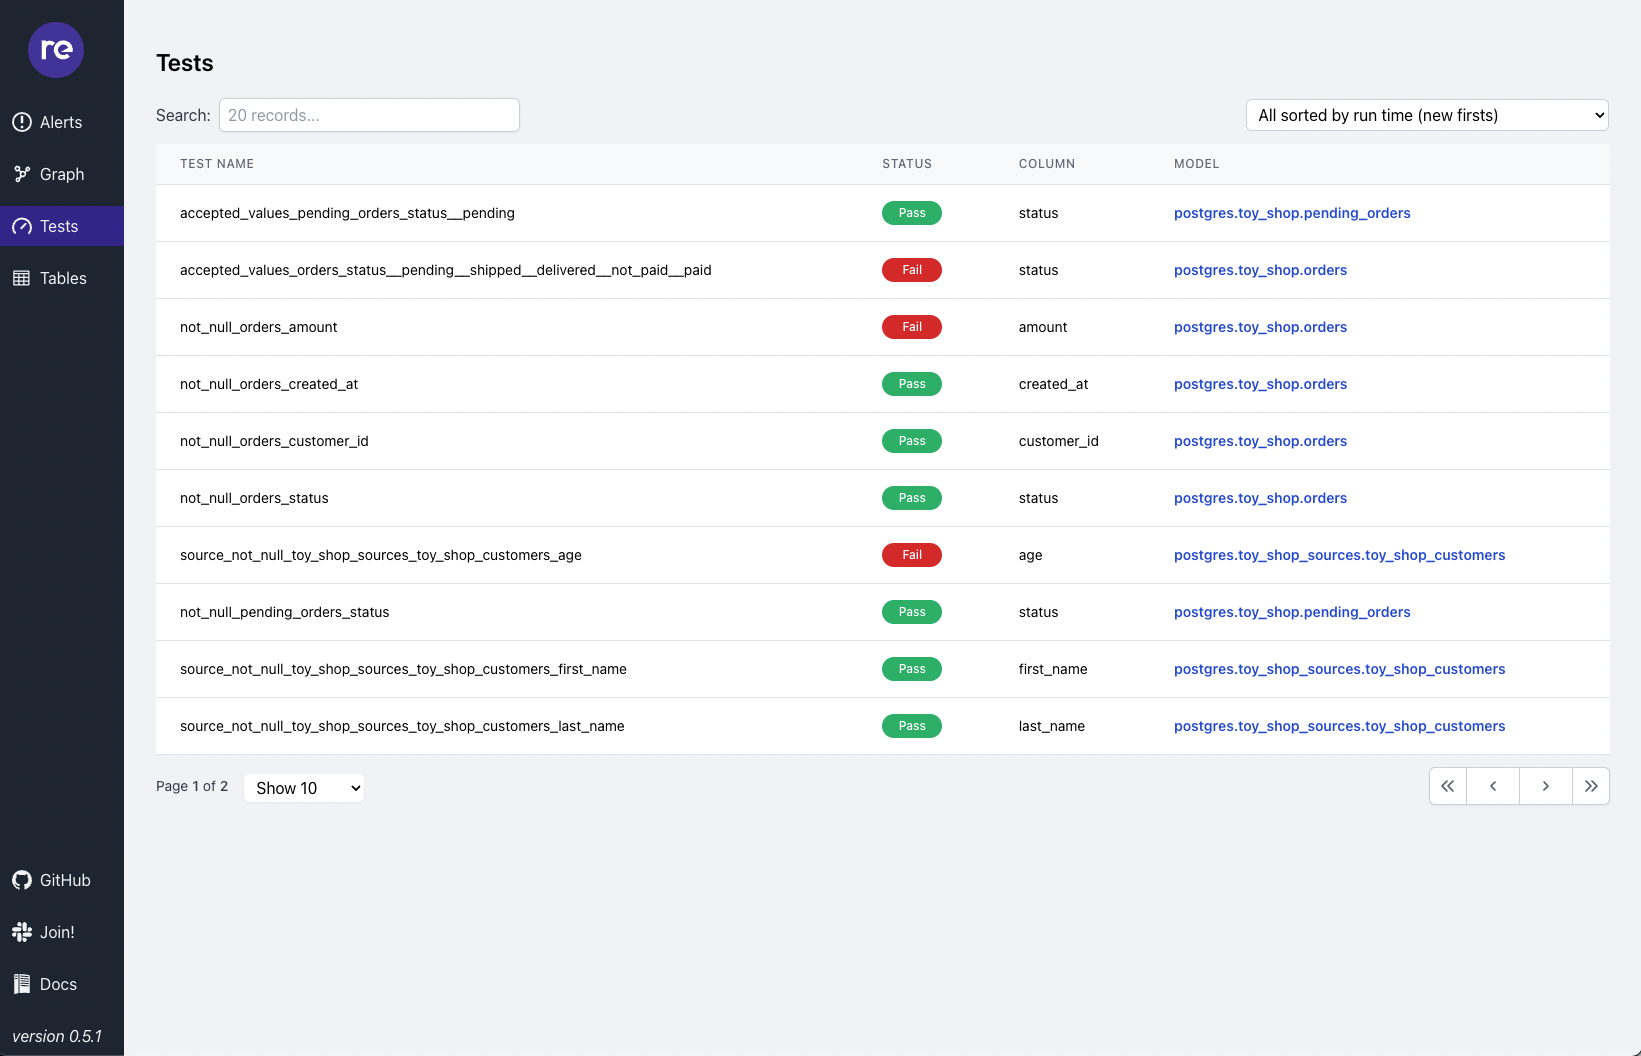
Tests view lets you see history of all dbt tests run. (re_data comes with a save_test_history macro which when passed into on-run-end dbt configuration, saves tests history into the data warehouse)
Tables#
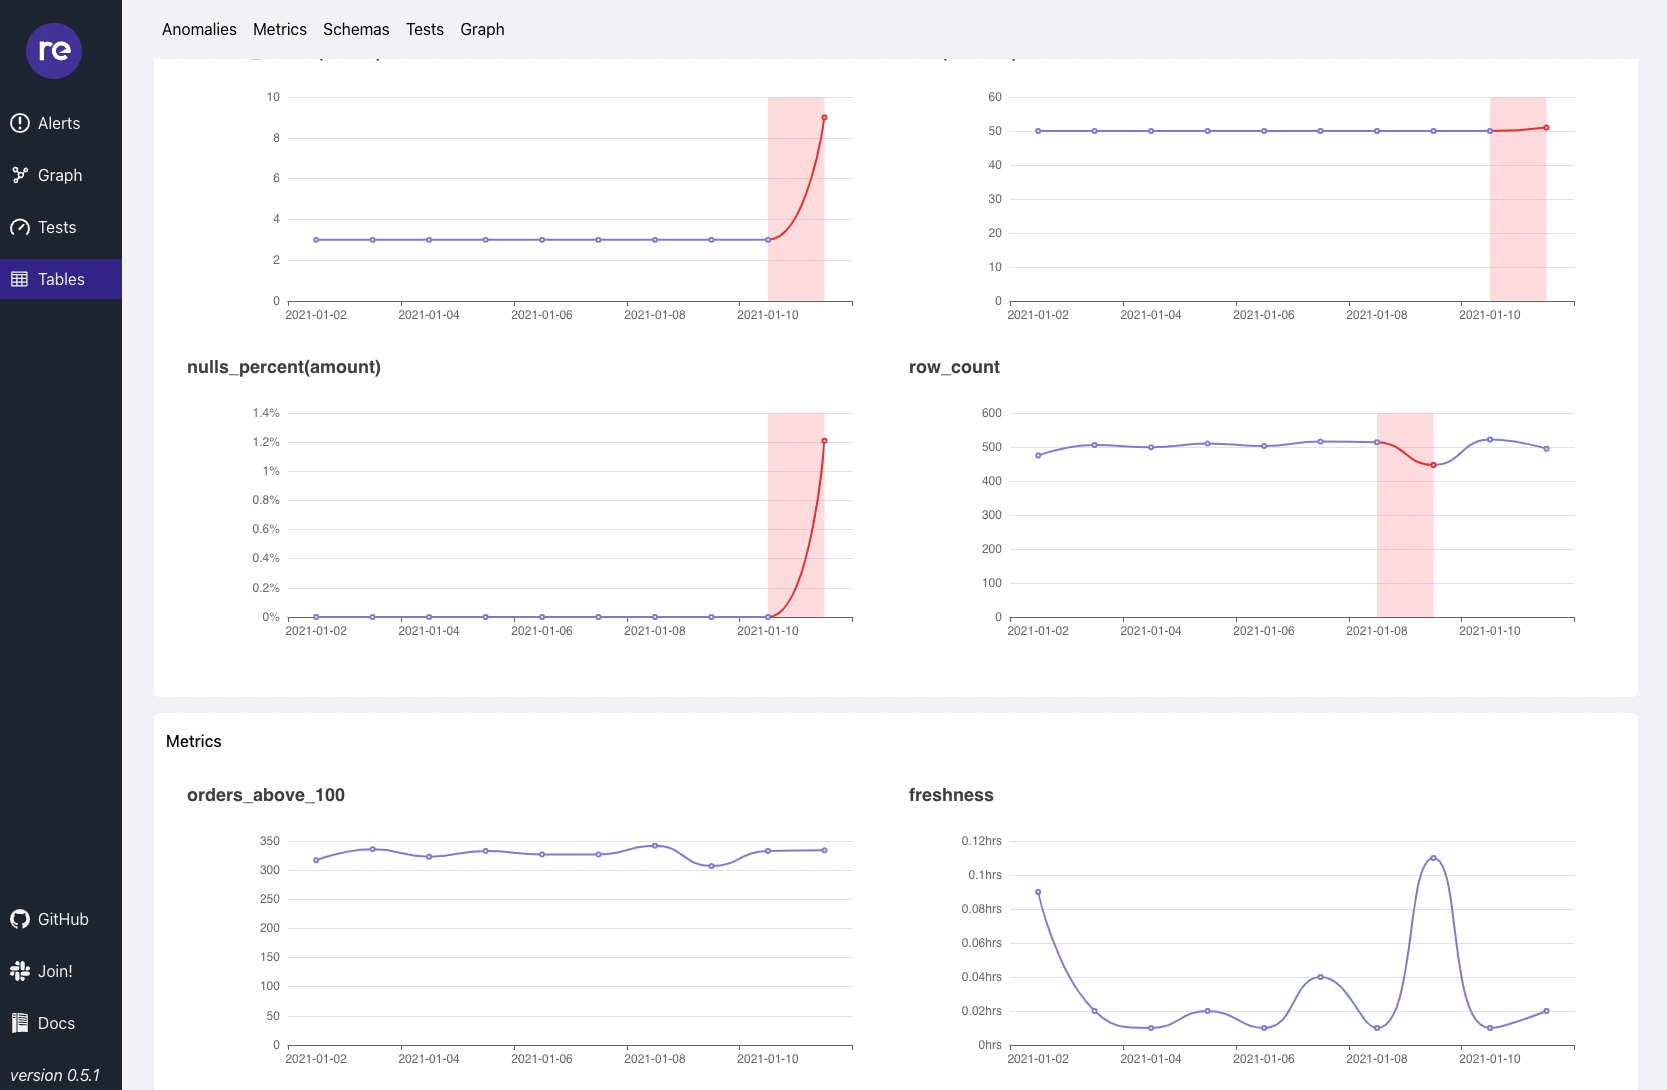
Tables view lets you investigate any table easily. Check out for anomalies, metrics, tests related to it.
In the next section, let's see how we can notify ourselves about problems in the data